The FilmStar Workbook provides
capabilities not readily achieved otherwise. Consider yield estimation for a
multi-angle coating specification that includes average, min/max and ripple. The
Workbook makes such analyses easy. Another example is optimization in which
layers are restricted to given ratios and thicknesses.
The FilmStar Workbook is an Excel-compatible
(Excel not required) spreadsheet supporting two file formats: *.vts (native) and
*.xls (Excel 5.0/95). The Workbook is activated (DESIGN, MEASURE) via Tools..
Workbook <F3> or by clicking the Workbook icon. The MEASURE (Scantraq) Workbook is similar but lacks Setup,
Design and Optimize menus.
In this page we introduce basic Workbook concepts and illustrate tolerancing and
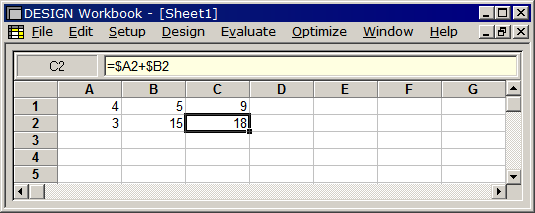
optimization. To begin, activate the Workbook and click File.. New to arrive at the following.
Add some formulas just as in Excel.
Workbook
functions connect to FilmStar via defined names. A defined
name labels a cell or a group of cells. FilmStar assigns special meanings to the following eight names:
DataMarker - Data upper
left
DataType - Details about
the data
Passed -TRUE or FALSE
Macro - Commands to be executed
DESIGN only:
Design - Thin film design
Objective - Optimization
merit function
Constraint - Optimization
constraint(s)
Yield - Tolerancing %
Passed=TRUE
See FilmStar Help (DESIGN
Reference.. FilmStar Workbook.. Defined Names) for details. Note
that special defined names are automatically indicated with
yellow
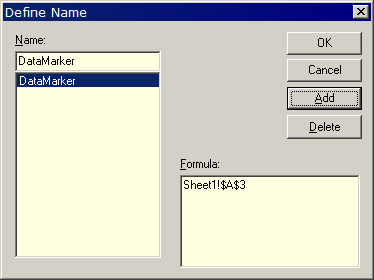
background. You add a defined name with Edit.. Define Name <F6>.
Close the Workbook and open FILM
Archive BBAR. Click Setup.. Graph Axes <Ctrl+G> and verify that calculation
range is 450-750 x10 (Inverse wavelength spacing unchecked). Click the
Calculate button to evaluate the spectrum. Re-save BBAR.faw with the new
range.
Activate the Workbook and open c:\Winfilm\Workbook\QCBBAR.xls. There are three defined names:
DataType ($B$1), DataMarker
($A$3) and Passed ($E$8). DataType=1 gives R/T in the range 0-100% rather
than 0-1. Cell Passed {AND($E$5<=0.5,$E$6<=1)} is TRUE when average %R is <=
0.5% and maximum %R is <=1.0%. DataMarker merely indicates the location of
spectral data. Note the use of AVERAGE ($E$4) and MAX ($E$5) functions. Can't
see these functions? Click <F7> to open the edit bar or <Shift+F7> to display
all functions. Note how much easier it is to compute average and maximum with
spreadsheet functions than with BASIC code.
In normal operation spectral data is automatically pasted when the Workbook is
activated by clicking on it. As will be demonstrated later, the action can be
defeated when necessary. At this time we suggest that you reproduce the steps
illustrated in the video shown below. Comment: there is no particular reason why
cell $A$1 has a cyan background.
You might like to use colors to highlight labels, but never use
yellow!
With the
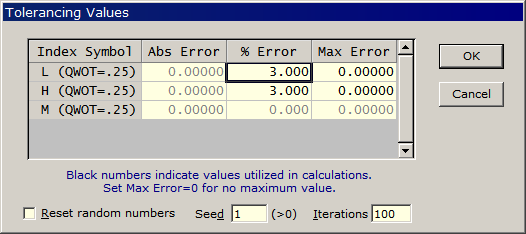
optimized design loaded, activate the Workbook and click Evaluate..
Tolerancing.. Values <Ctrl+N>. Enter 3.0% and 100 Iterations as
shown. Click Evaluate.. Tolerancing.. Run <Shift+Ctrl+F9>.
At the conclusion note that % yield is displayed in the main window
status bar. This is not entirely satisfactory because the value can be
erased by moving the mouse. As an alternative add defined name
Yield to cell $E$10 and
repeat the calculation.
Returning to the main
DESIGN window, reload the original (unoptimized) BBAR file (design .1H
.1L .5H .25L) checking that the graph range is 450-750 x 10 nm.
Calculate the spectrum to verify and re-activate the Workbook. Add
defined name Objective to
cell $E$5 {AVERAGE($B$4:$B$34)}. An objective (aka merit function) is a
quantity to be minimized. Click Optimize.. Optimize <Ctrl+O> in
the Workbook window to minimize average reflectance. Finally, click on
the main DESIGN window and recalculate the spectrum.
Why optimize in the Workbook rather than the main DESIGN window? In this case there is no reason;
we would do as well with the usual optimization targets. Here we
are merely showing how things work. The advantages of Workbook
optimization will become evident in subsequent Workbook Tutorial pages.
Before leaving this page, return to QCBBAR.xls and set DataType=3. Now
go back and forth between the main DESIGN window and the Workbook.
Notice how spectra are transferred to multiple columns. You have just
activated looping, the subject of the next Workbook tutorial.