Technical Issues - Multiple Spectra in FSPlot
1. Users might not realize that FSPlot can
save (and open) multiple spectra with same wavelength range and interval in a single
(Excel) CSV file. Similarly, it is possible to copy multiple
spectra to the clipboard. This capability (FSPlot Data Menu) is
especially useful in MEASURE when multiple parts are scanned.
Click here for further
methods for saving multiple spectra,
here for an easy MEASURE method for labeling multiple curves,
and here for a general (DESIGN and
MEASURE) method utilizing BASIC.
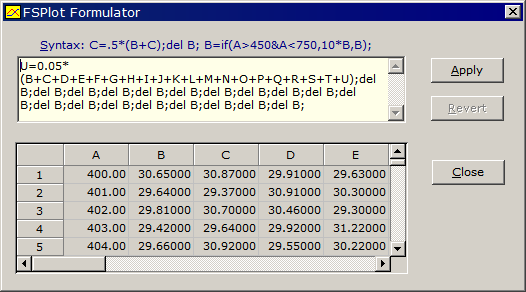
MEASURE 2.50.1426 removes a previous limitation of 12 spectra. (This corresponds to the maximum number of plot legends; there was no limitation in DESIGN.) While there is an eventual limitation, hundreds of scans each containing hundreds of data points are possible. 2. FSPlot Formulator capacity has been increased from 12 to 20 spectra. In the screen shot below, the formula for averaging 20 spectra is given. While there are several ways to average spectra in FilmStar, this is the simplest.
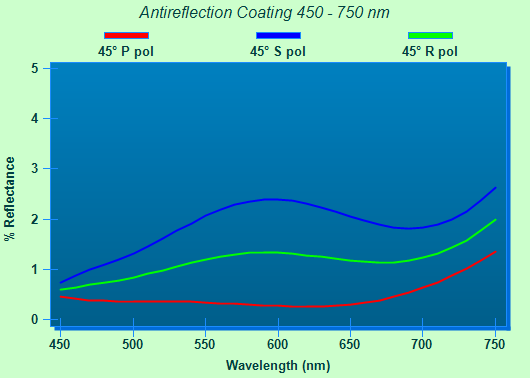
A useful application for the Formulator is plotting P, S and R curves where P and S are measured and R computed. The formula is simply D=.5*(B+C) {show P,S,R} or C=0.5*(B+C);del B {R only}.
3. Several BASIC functions can be used to automate multiple spectra operations: PlotDataCopy, PlotDataPaste, PlotDataOpen, PlotDataSave. PlotRun triggers the Formulator as shown below:
|
Copyright © 2023 FTG Software Associates
Last updated on
January 31, 2023