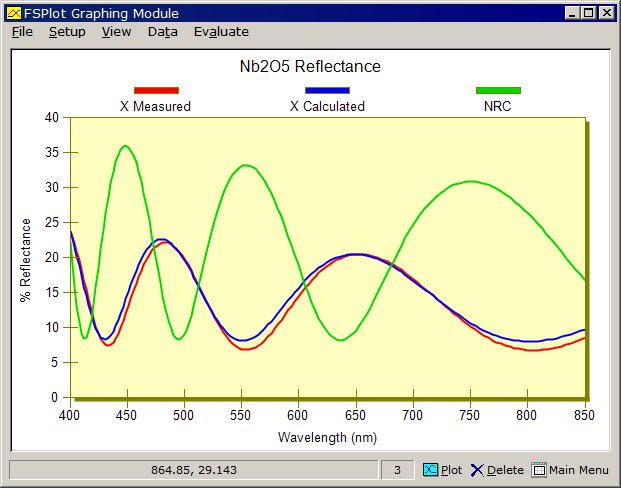
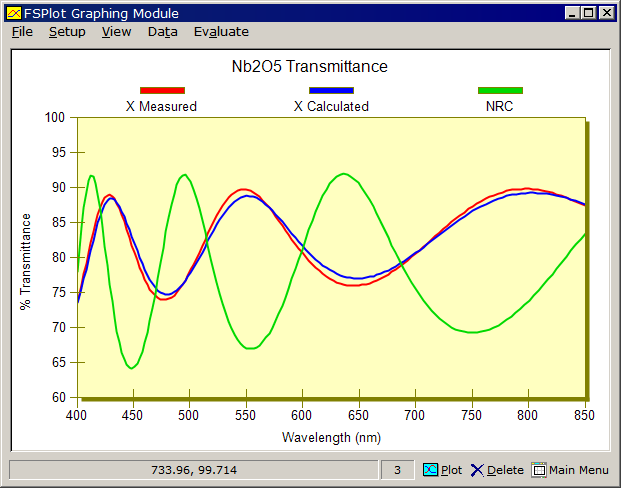
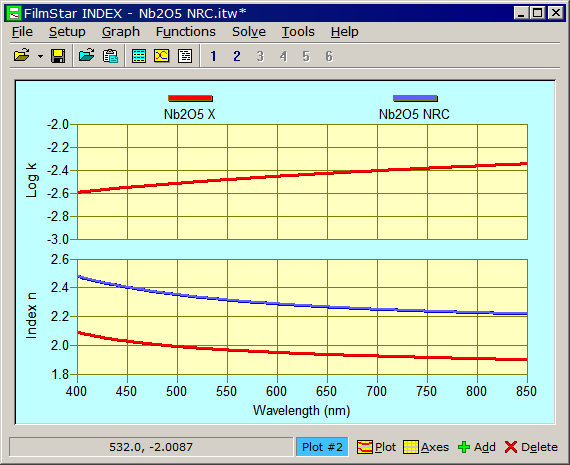
Nb2O5 StudyIn Sep 2011, an equipment manufacturer (company 'X') asked us to deduce n,k for Nb2O5 deposited in a large coating chamber. The spectra suggested highly absorbing films with n values far below expected values. Needing a comparison, we found an n vs. wavelength graph in Sullivan et. al., Appl Optics 39, pg 161 (2000). In what follows this is labeled as 'NRC' for National Research Council in Ottawa (a FilmStar user, by the way). When we considered the measured spectra we realized that peak analysis (envelope method) would not work and thought to apply a dispersive function previously utilized for highly absorbing TiO2 (cold deposited). Using both reflectance and transmittance data, we arrived at reasonably good fits as shown below.
The red lines show the generalized Cauchy (FilmStar function $CYGENK2) fit. Film thickness is 420 nm and coefficients are given below. Increased absorption towards long wavelength is not expected in oxides. We expect that these initial results will be much improved upon in coming weeks.
|
Copyright © 2023 FTG Software Associates
Last updated on
January 31, 2023