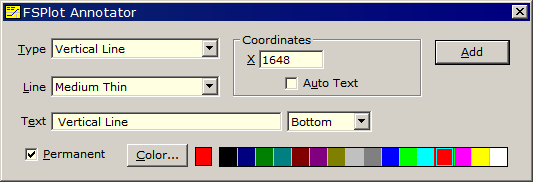
Technical Issues - FSPlot Tutorial III - AnnotationsFSPlot graphs include spectral data, legends, and annotations. Annotations include lines, text and other graphics elements independent of spectral data. Annotations are stored with DESIGN Graph Axes (*.axw) or FILM Archive files (*.faw) as well as MEASURE (Scantraq) Method files (*.scw). Click on an FSPlot graph to bring up the Annotator. Edit coordinates if required. For example, if you click on a graph and get 636.4 nm you can change it to HeNe wavelength 632.8 before clicking Add. Alternatively you can return to the annotation and adjust later.
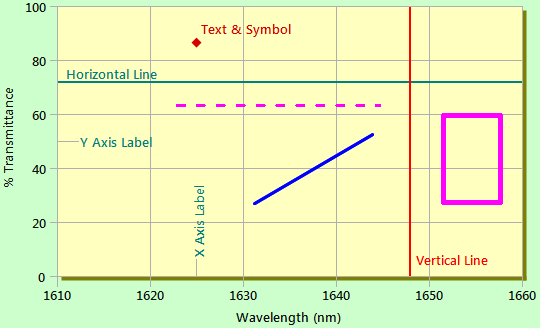
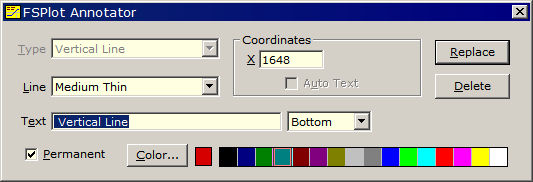
As shown above there are a number of annotation Types. What happens if you need to adjust thickness, text, color or position? Use the mouse to locate the annotation to be changed. When the cursor changes to a pointing finger, a click activates the Annotator again, but now Type is disabled and there are Replace and Delete buttons instead of the Add button (only Delete for rectangles).
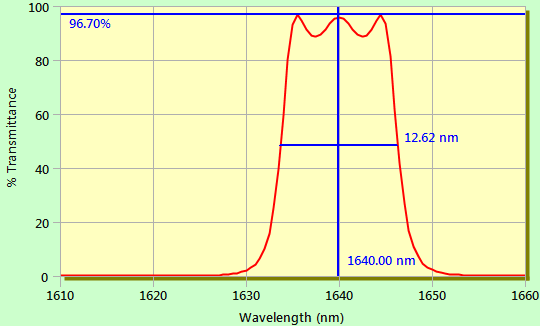
Annotations might include lines marking various reflectance specifications over a wavelength range or denoting a bandpass filter envelope. Click here for an example built into FilmStar MEASURE. Such static annotations do not require further explanation and are well-handled with the Annotator. Annotations can also be dynamic,
i.e. computed from spectral data. While this useful and powerful
capability requires a deeper understanding, the task is greatly simplified by
the BASIC code generator in DESIGN and MEASURE. To start, open FILM Archive
fnum.faw. This design is utilized for cone-angle calculations as well as
computed annotations and is included in the FilmStar installation.
Click Setup.. Annotations.. Edit <Ctrl+T> to view the annotations explained below.
How to set this up? 1. Use the Annotator to draw required elements. 2. Click Setup.. Annotations.. Create BASIC Code and paste into the BASIC editor. 3. Replace appropriate numbers with functions in your BASIC code. See this page for further discussion on the same example. Finally we return to the first graph showing all annotation types. Open FILM Archive fnum.faw or adjust axes range in Graph Axes. Highlight the left column (starting with line VERS3), copy to the clipboard, and paste into the Annotation Editor dialog.
Here's the graph again:
You can now practice modifying the graph with the Annotator. |
Copyright © 2023 FTG Software Associates
Last updated on
January 31, 2023