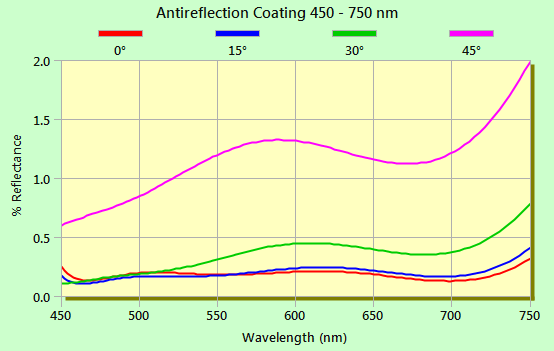
Technical Issues - FSPlot Tutorial IV - FormulatorThe Formulator is one of FilmStar's more unfamiliar features. It was added when a MEASURE user requested the ability to enhance graph details (click here). Another MEASURE user requested a simple way to generate R curves from measured P & S. The Formulator also provides means to save multiple spectra in a single file. Consider the BBAR graph from Tutorial II - Legends. Were you able to create this with FilmStar BASIC? If completely baffled be sure to contact FTG for an online explanation via ZOOM.
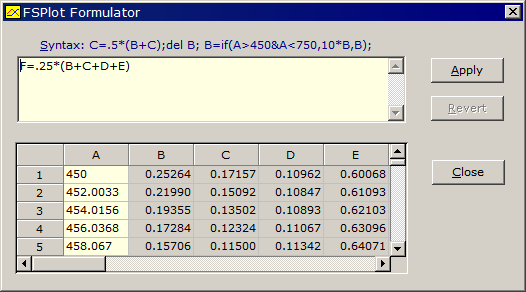
Suppose you want to plot average reflectance. This could be accomplished with the Workbook, BASIC or Excel, etc. But the easiest is often the FSPlot Formulator. Once you have displayed the graph, click Data.. Formulator <Ctrl+F>, type the equation shown below and click Apply.
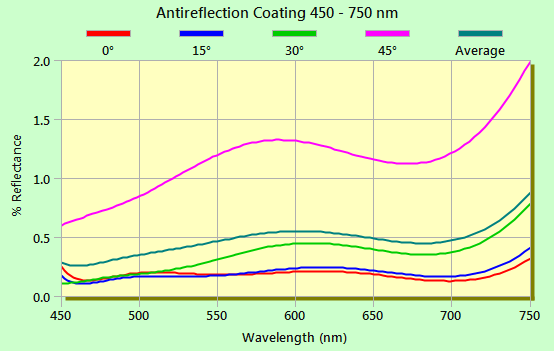
Observe the new fifth line (dark green). You will need to edit line legends Setup.. Legends <Ctrl+E> and enter or change legend #5 to 'Average'. The Formulator applies formulas to entire columns.
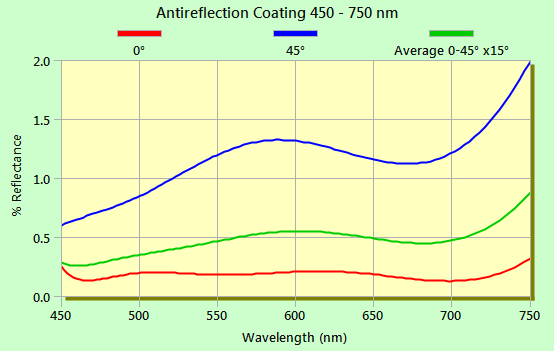
At this point your manager suggests that the graph is too complicated and it is only necessary to plot 0°, 45° and Average. This is accomplished by adding delete commands del to the formula: F=.25*(B+C+D+E);del C;del C The first del C deletes the 15° column; after that the 30° spectrum is column C. Click Revert to undo the formula. This finally gives us, after adjusting legends #2 and #3:
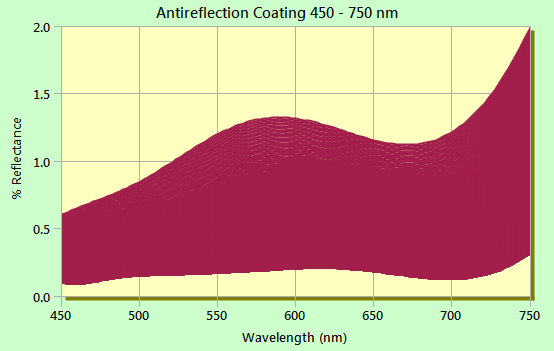
The Formulator Data menu supports clipboard and file operations. This makes it possible to replot multiple curves without having to recalculate or scan. When there are more than 20 spectra the Formulator is disabled, but clipboard and file commands in the FSPlot Data menu still work. The graph below contains 52316 data points (0-45 x0.1°). Ultimately there will be a memory error, but the limit is very high.
Advanced users can take advantage of BASIC commands supporting the Formulator: PlotRun (run a formula), PlotDataCopy, PlotDataPaste, PlotDataOpen and PlotDataSave. Data is in Excel CSV format. |
Copyright © 2023 FTG Software Associates
Last updated on
October 11, 2023