|
Technical Issues - FilmStar News 2018 Other editions:
2006, 2007, 2008,
2009, 2010,
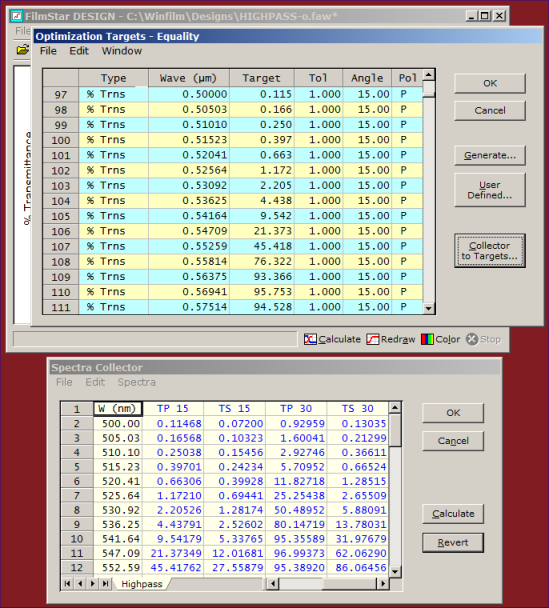
2011, 2012 January 2 Collector to Targets DESIGN...Reverse-engineering can be more reliable when P/S measurements at angles > 0 are included. New multi-angle attachments (Cary UMA, PE Lambda with ARTA/TAMS) and the Spectra Collector enable users to save data in a single file. That capability has been enhanced with DESIGN 2.61.4150 able to quickly convert multi-angle spectra to Optimization Targets. (Previously this required opening multiple spectra and tediously converting one at a time or writing a macro utilizing BASIC Function SpecTargets.)
The procedure is as follows:
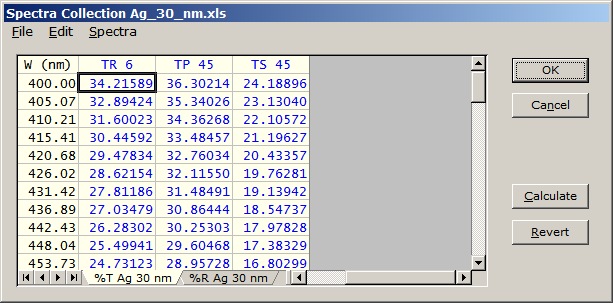
Note that blue cells in the Collector grid indicate calculated data. Also note that Collector wavelength units (nm) were converted to current DESIGN units (µm). January 8 IndexSolve Updated with Collector IndexSolve.bas was
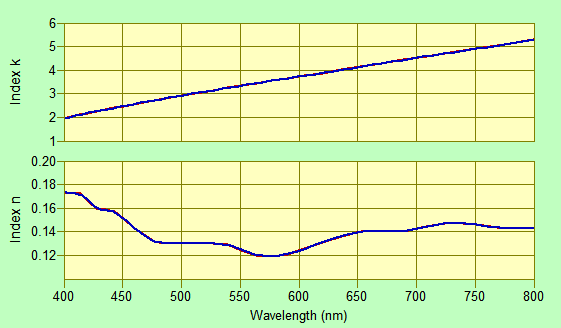
originally developed some years ago to
partially
automate a user's manual procedure for
deducing n,k for silver through %R/%T measurements at multiple
angles. The method is useful for metals of known thickness when it
is impossible to utilize dispersive functions. The method depends on
selecting a film thickness wherein both %R and %T can be accurately
determined.
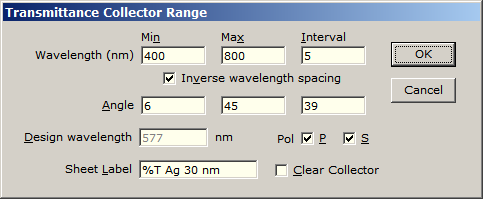
You need to run the calculation twice, for %T and %R. The values shown below were utilized.
Upon running this you
obtain TP/TS and RP/RS 6° columns. These were averaged (giving TR
and RR) by highlighting adjacent 6° columns and clicking
Spectra.. Average P and S. If columns are not highlighted all
P and S columns are averaged. In practice, data are generated by
FilmStar MEASURE or by other programs via Excel transfer to
Collector format.
Exercise for advanced users: Add noise to calculated spectra and see how it affects results.
January 29 Spektrum Support for CEC
Deposition Systems
Cutting Edge Coatings
(CEC) in Hannover, Germany manufactures deposition systems utilizing
the Laser Zentrum Hannover (LZH) Spektrum file format (.dsg).
Click here
to view or download a sample design file created in FilmStar DESIGN;
open in Notepad or (recommended)
Notepad++. Note that
some of the '##' settings refer to Spektrum software and are
not utilized by CEC.
Users unfamiliar with this advanced dialog should contact FTG
Software to arrange a ZOOM meeting. At this time the
Spektrum Oscillator Model is not supported.
IMPORTANT: The CEC system recognizes if the expected Spektrum syntax is incorrect, for example if it cannot read material data. It cannot, however, detect erroneous values. Users must inspect layer values and verify that the final transmission spectrum matches DESIGN's. It is the user's responsibility to ensure that proper information has been uploaded to the system prior to deposition. February 26 Peaks & Valleys in MEASURE/Scantraq
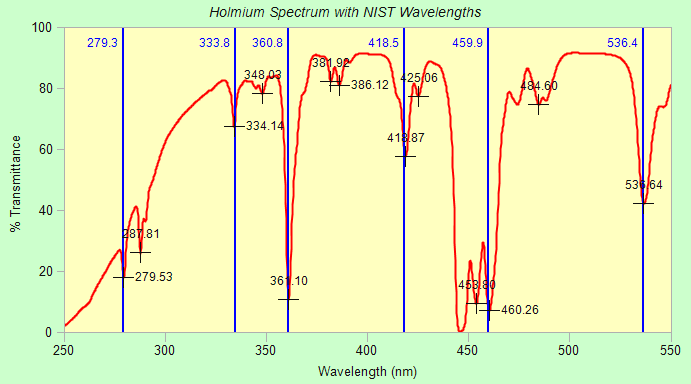
The ability to show peaks in FSPlot was
added in 2011. In response
to a user utilizing the holmium spectrum to determine wavelength
accuracy in a Lambda 950, we added valleys in FSPlot
Setup.. Peaks <Ctrl+K>. Note that annotations (here
vertical lines displaying NIST wavelengths) must be added before
plotting the spectrum. Finally, don't forget to check View..
Peaks <Ctrl+P>. As can be seen below, %T peaks are not of much
use in this calibration procedure; NIST wavelengths refer to
valleys.
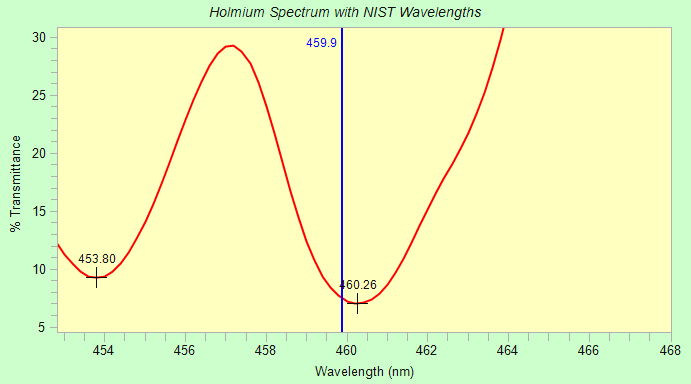
Use the Zoom function to examine and verify results. Asymmetric extrema might be problematic.
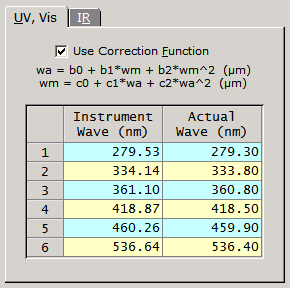
New BASIC Sub WaveCorrect applies the Correction Function to an existing uncorrected spectrum. This should only be run ONCE! April 10 Air and Substrate 'Layers'
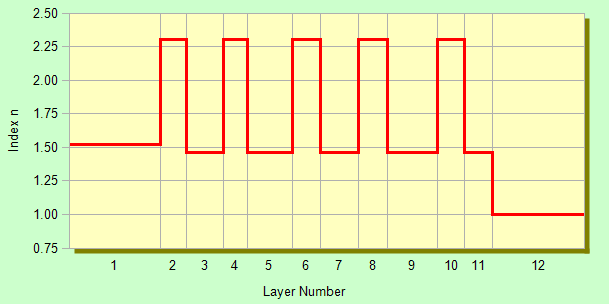
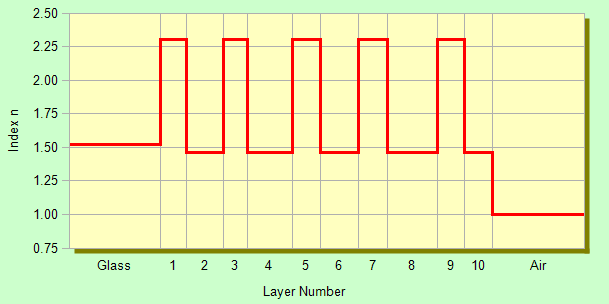
How to tell DESIGN not to label layers 1 and 12? The following method was devised: insert an asterisk in the Film Indices Description column (<F3> for quick access), followed by optional text to be displayed. Note that this only modifies outer layers. An air layer in the middle of a stack would be counted as a layer.
We then have the following:
This works with various plot types with thickness axes in the main menu, FSPlot, and Interactor. It is especially useful when plotting electric field. The feature was introduced in DESIGN 2.61.4193. April 16 Absorptance in Specified Layers
A user needs to calculate absorptance in a specified layer at
non-zero angle of incidence. This required an update since DESIGN
was limited to angle = 0. We then needed to verify results. This was
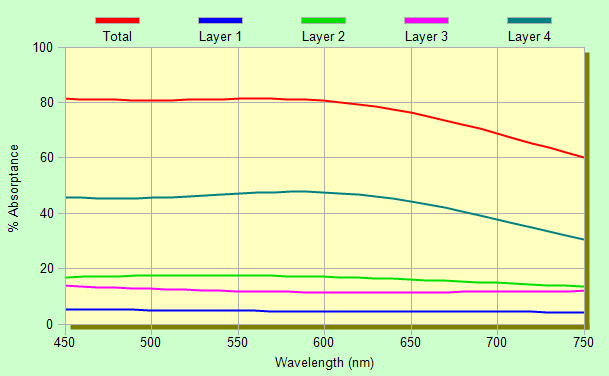
accomplished by collecting spectra in FSPlot to see whether partials
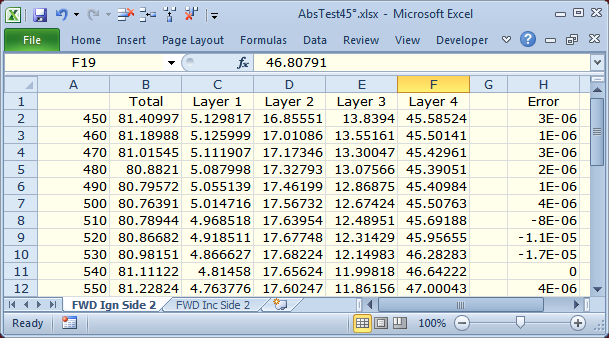
add up to total %A. We tested 45° R-pol. (Design 100H 100L 100H
100L, L: 1.46 + 0.2i , H: 2.3 + 0.1i, AIR: 1.0, SUB: 1.52).
Looks good, but we need to calculate the difference. Click Data..Copy in the FSPlot Module and paste into Excel. Set $H2=$B2-$C2-$D2-$E2-$F2 {or $H2=$B2-SUM($C2:$F2)}, and copy the formula to subsequent rows. Results indicate that the algorithm works as designed.
Copy and paste? That's no solution for an advanced user, so read on! Addendum April 23...FilmStar BASIC users can utilize enhancements in DESIGN 2.61.4211 whereby Sub XLwrite allows numeric/text formulas as well as numeric or text entries, and Sub XLnew supports R1C1 references (for our purposes far more convenient than column letters). AbsMulti.bas (updated 31 Mar 2020)calculates spectra and activates the Excel Viewer. It works with any number of layers. XL functions are available in ALL FilmStar programs. Excel is NOT required. Having specified R1C1 references in XLnew, the XLwrite numeric formula in column 8 evaluated at row 2 is R2C2-SUM(R2C3:R2C6). Functions such as SUM which can be utilized in formulas are listed here. A formula starting with = denotes a numeric cell; a formula starting with & denotes text. Anyone familiar with Excel notation should find this straightforward.
Finally, as shown here, formulas can be also utilized in the FilmStar Workbook (BASIC WbSetFormula) but, lacking R1C1 notation, cell addresses get messy beyond 26 layers. April 30 UMA Scan Macros MEASURE's
Scan Macros
provide means to display QA instructions in local languages. A macro can
consist of a BASIC file name or multi-line BASIC code. Scan Macros are saved
with Scan Method, thus different from Macro Commands (Tools menu) which do
not change when a new Scan Method is opened. A typical macro might be
MsgBox "Check that there is no optic in the sample compartment."
Sub XLwrite does not overwrite spectral files, saving instead with appended numbers: Collection1.xlsx, Collection2.xlsx, etc. (Data file names are optional since data can also be saved in the Collector.) DO NOT USE Scan Macros when scanning with BASIC Sub Scan. May 1 CIE Tolerancing An engineer at a filter manufacturer
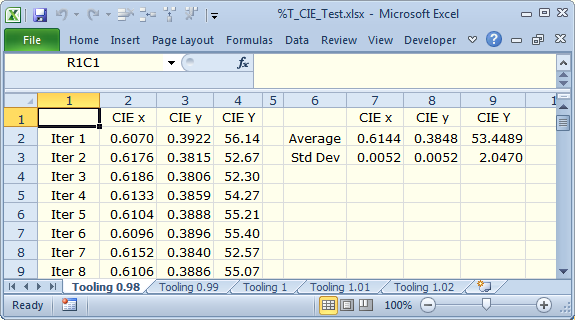
requires Monte Carlo calculations related to color variance. It took us
about a half hour to create FilmStar BASIC code giving the screen below.
Here we assumed 2% SD layer variation. Referring to the
code listing,
'Tooling range' accounts for non-uniformity. Note our use of AVERAGE and
STDEV. The complete list of functions can be
found here; any similarity to Excel is intentional!
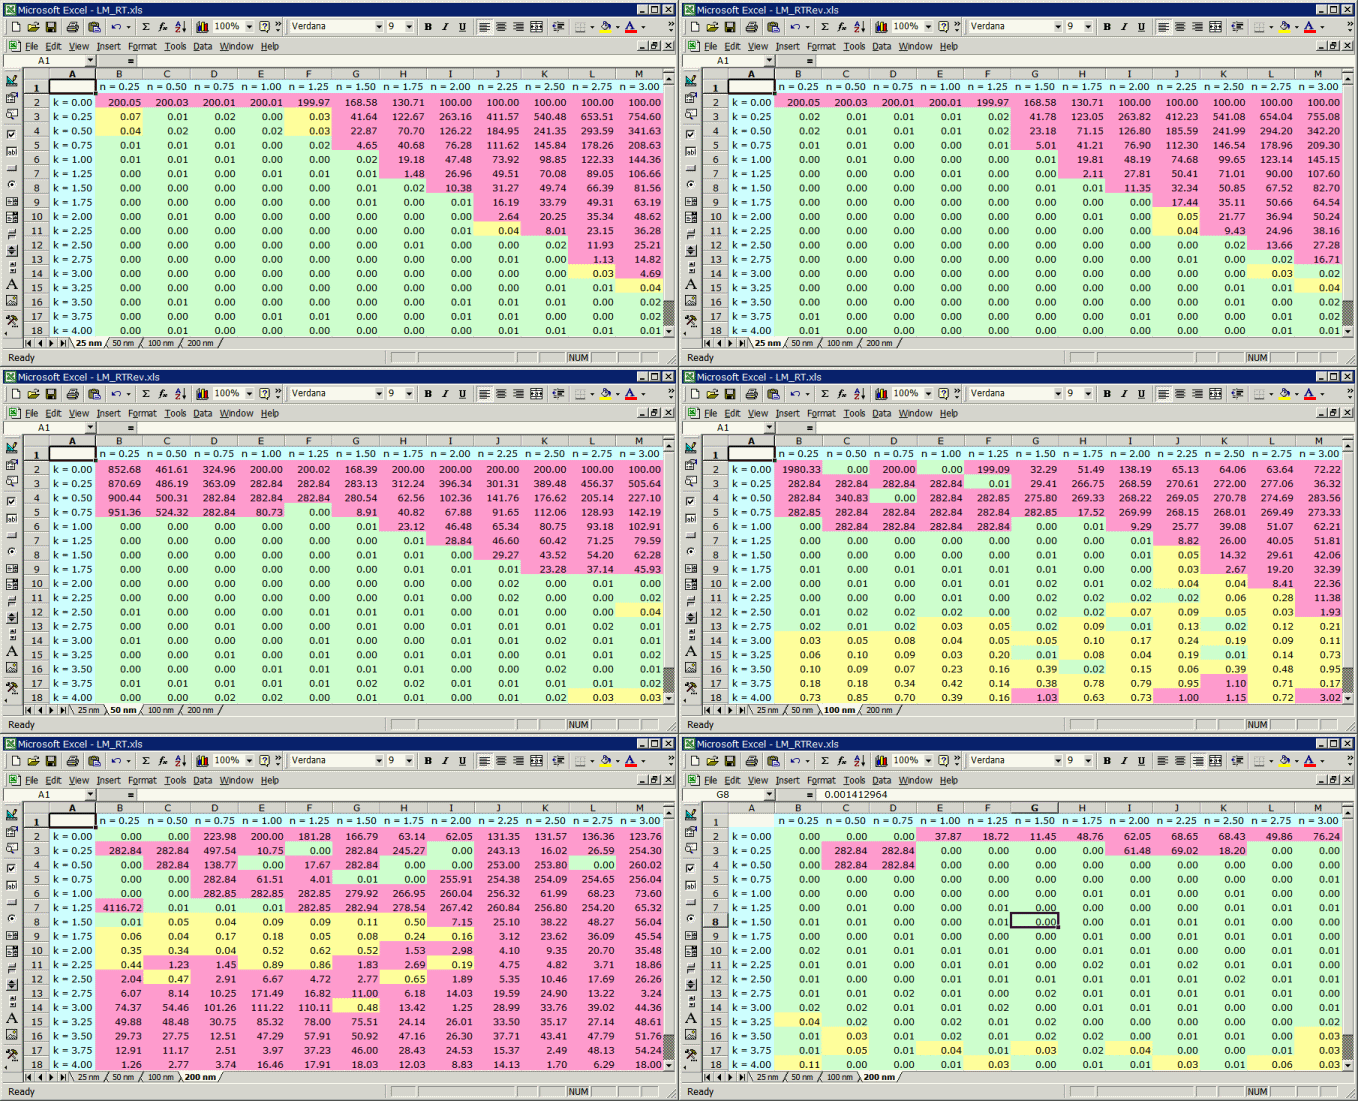
Our next step would be to define a CIE acceptance box and calculate % yield. With FilmStar that is an equally straightforward task. June 14 n,k Solution Grid The following introduces Gedankenspektrum research underway at FTG Software and Willey Optical to be reported at OSA OIC 2019. Consider a single absorbing film on a transparent substrate. What measurements are required to determine n,k (film thickness known) or n,k,d at a given wavelength? %R and %T certainly, but what about reverse %R (thanks to a FilmStar user for this suggestion) or P/S measurements at multiple angles? These issues are amenable to analysis with FilmStar's ability to directly create multi-tab Excel files. Color provides a sort of contour plot.
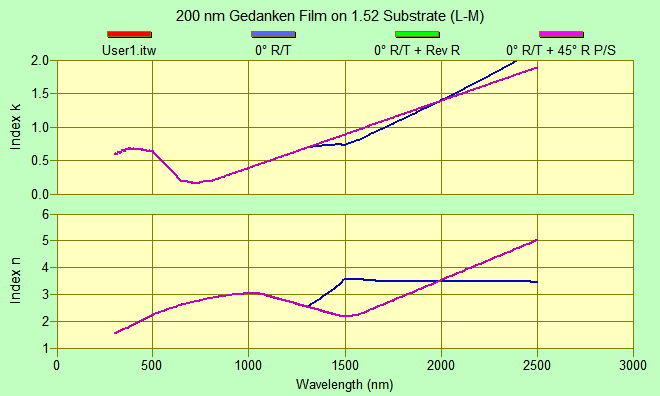
In a variation of IndexSolve.bas we determine indices from calculated (for testing) or measured spectra, the above chart (200 nm) is corroborated below where we see that 0° R/T (blue trace) is insufficient over the entire wavelength range. Adding reverse R at 0° or 45° R P/S leads to a correct solution (L-M method). (User1.itw is a user-supplied Gedankenspektrum test file.)
June 21 XLsave Tab-Delimited Output NOTE: This topic is intended for advanced users
familiar with FilmStar BASIC and FileMaker scripting. In summary, it
demonstrates how to transfer data from FilmStar MEASURE to a FileMaker Pro
database. Please contact us for an
online demonstration at your
convenience. SetIlluminant 2 ' Illuminant A GetCieData x, y, yy Clipboard Format$(x, "0.0000") & ", " & Format$(y, "0.0000") & _ ", " & Format$(yy, "0.000") Pasting is complicated and becomes unwieldy with many fields to be transferred.
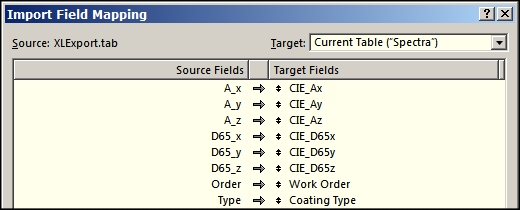
While testing FileMaker 17 we realized that data transfer could be based on FileMaker's Import Records facility. This takes advantage of FilmStar's new abilities to create Excel files. Unfortunately that failed as FilmStar .xls and .xlsx files are incompatible with FileMaker's Excel import; but tab-delimited files are compatible, so we modified BASIC Function XLsave accordingly. Essential steps shown below... Kill "C:\Winfilm\Temp\XLExport.tab" ' re-use temp file '... SetIlluminant 2 ' Illuminant A GetCieData x, y, yy XLwrite 2, 1, x, 4: XLwrite 2, 2, y, 4: XLwrite 2, 3, yy, 3 '... XLSave "C:\Winfilm\Temp\XLExport.tab" ' new TAB option in all FilmStar programs In the following we export Work Order and Coating Type as well as CIE A and D65. Each record has a header row and single data row.
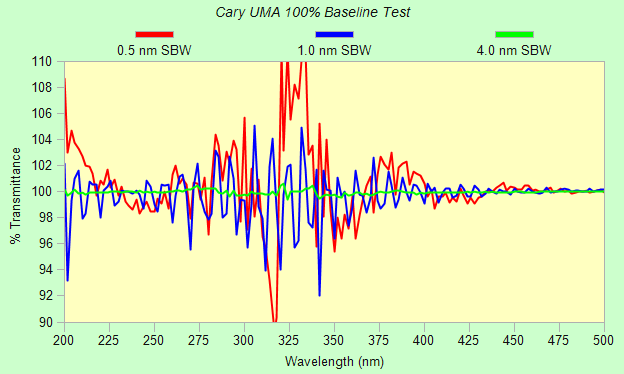
FileMaker maps data to corresponding Target Fields... As an alternative, tab files can be created directly by BASIC without XLsave... Kill "C:\Winfilm\Temp\XLExport.tab" ' re-use temp file Open "C:\Winfilm\Temp\XLExport.tab" For Output As #1 Print #1, "A_x" & vbTab & "A_y" & vbTab & "A_z" & vbTab & _ "D65_x" & vbTab & "D65_y" & vbTab & "D65_z" & vbTab & _ "Order" & vbTab & "Type" ' header row '... SetIlluminant 2 ' Illuminant A GetCieData x, y, yy s$ = Format$(x, "0.0000") & vbTab & Format(y, "0.0000") & vbTab & _ Format$(yy, "0.000") & vbTab '... Print #1, s$ Close #1 XLsave or BASIC Print?? We think XLsave is somewhat easier to debug and modify. In any case, TAB files simplify data transfer from FilmStar to FileMaker. A little complicated at first? Perhaps, but an opportunity for engineers willing to put some effort into career success. It's NOT string theory. June 28 Cary UMA UV Issues A user reported that Cary UMA spectra were noisier in FilmStar than in Agilent's WinUV. Screen-sharing revealed that WinUV had utilized default 4 nm SBW (spectral bandwidth) while FilmStar was set to 0.5 or 1.0 nm. Upon retesting MEASURE, performance was seen to be equivalent as shown in the FSPlot curves below. The traces represent two 100% baseline scans (no sample, detector 180°, no polarizer) divided by each other.
Noise will be increased if the polarizer is
used and reduced by longer SAT (signal averaging time). Should long times
adversely affect throughput, consider scanning UV and visible regions
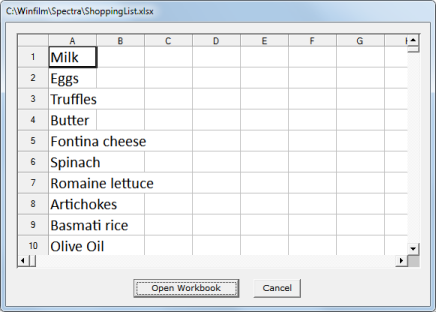
separately and combining afterwards. July 2 FTG Excel Viewer Supplementing FilmStar support for directly opening and saving Excel files, we adapted the Microsoft Excel Viewer for verifying files before opening. Unfortunately Microsoft discontinued Office viewers in April 2018. We therefore introduce the FTG Excel Viewer (shown below) with the advantage of including <Open Workbook> and <Cancel> when accessed from Spectra.. Open or from BASIC Function XLopen.
Advanced users: Under BASIC control, the FTG viewer simplifies opening an XL file after viewing it. For example, in the revised version of our page discussing angular dispersion, the following code...
was replaced by the simpler (MsgBox not needed)...
July 20 DESIGN and MEASURE Startup Files Suppose a FilmStar
computer is connected to two spectrophotometers. Two possibilities:
two MEASURE executables or one (usually Mpe983.exe) running both
instruments. You require a procedure that sets the startup Scan
Method (*.scw) and directory. MEASURE, DESIGN and INDEX already
supported startup files, but the feature was not documented. MEASURE
2.51.1923 and DESIGN 2.61.4222 set paths as well. Here are three
possibilities:
Add FileOpen to open a
particular Method.
Add FileOpen to open a method. Add the DefaultPath command to specify the Spectra directory. p$ = "C:\Winfilm\Measure\Lambda900" s$ = "C:\Winfilm\Spectra\Laser Filters" DefaultPath p$, s$ FilePath(1) = s$: FilePath(2) = p$ This technique lets you change directories without restarting MEASURE. 3. Batch file (*.bat) (BASIC not required) opens the EXE and sets default Scan Method directory:
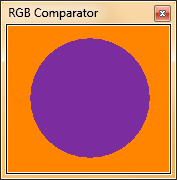
As always, users requiring assistance with FilmStar BASIC should contact FTG Software to set up a ZOOM tutorial session. August 2 L*a*b* Color Matching We were asked about meeting L*a*b* requirements. This inspired us to test DESIGN's CIE color algorithm. We started by discovering colorizer.org and, for no particular reason, selected purple as shown below.
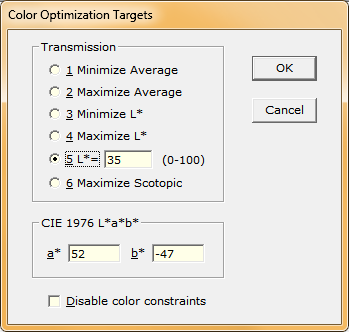
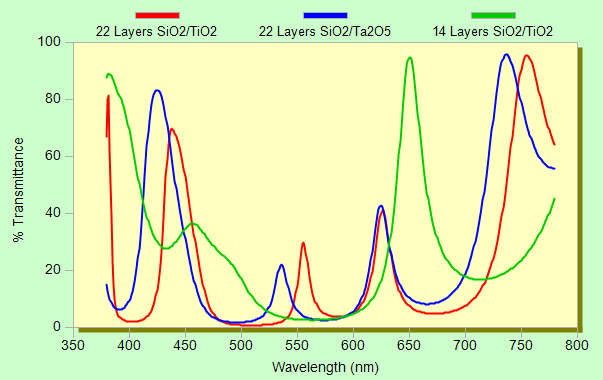
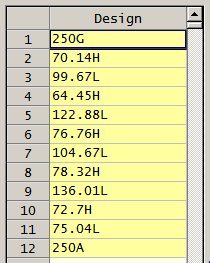
We designed a filter by starting with a 22 layer SiO2/TiO2 QW stack and optimizing in the CIE dialog using the Color Optimization Targets shown below. We changed materials to SiO2/Ta2O5 and re-optimized to find a different design giving identical color values. We then obtained the same L*a*b* coordinates with a 14 layer SiO2/TiO2 stack. FTG colleague Ron Willey reported a design with only 9 layers (FILM Archive .faw). It would be interesting to repeat with different light sources, including LED.
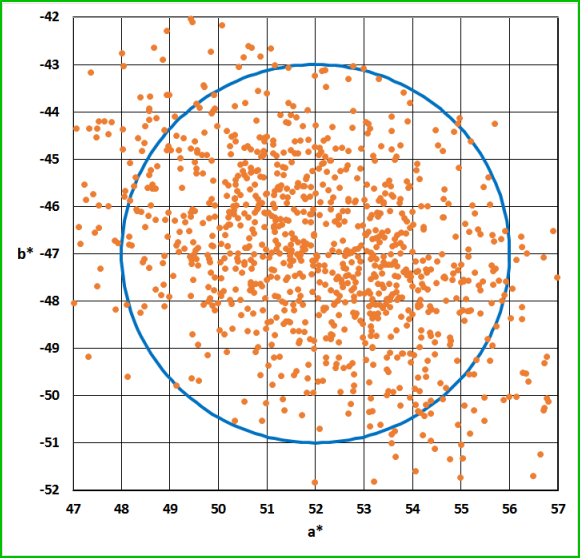
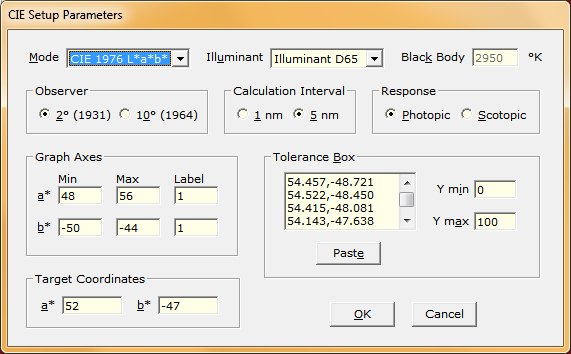
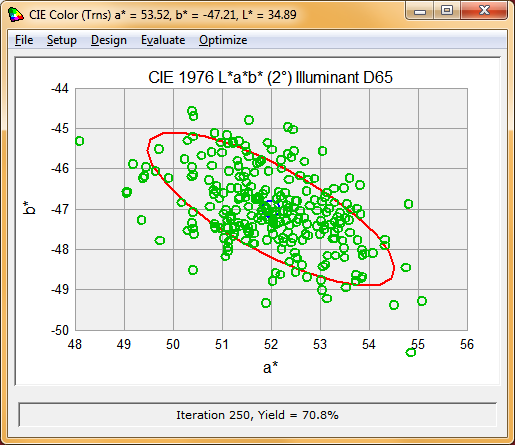
August 13 L*a*b* Tolerancing Coincidentally (see August 2 above), a FilmStar user requires CIE L*a*b* tolerancing calculations where color difference ΔE=Sqr((a-a0)^2 + (b-b0)^2) defines acceptance. Rather than implement this directly in FilmStar DESIGN, we found it far more useful to create an Excel workbook utilizing DESIGN CIE capabilities. Users should have no problem modifying the workbook for different color criteria such as L*u*v*.
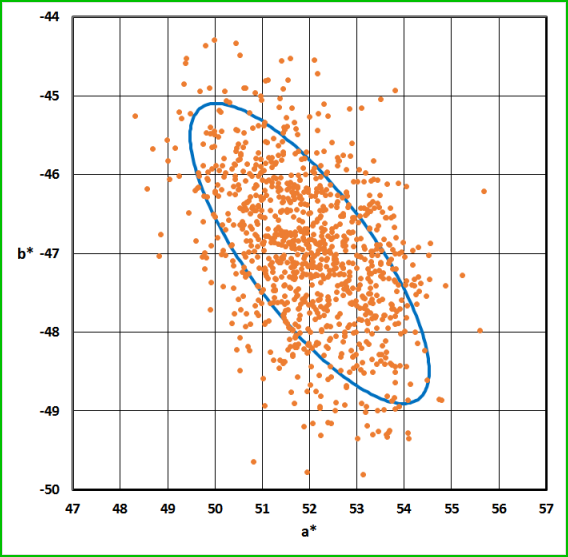
To reproduce the above chart, open Willey's 9 layer purple filter in DESIGN and then click Calculate in the Excel workbook. Referring to column A, the graph and Yield automatically update upon changing Center a*, Center b* or Radius. Press <Alt+F11> to view VBA code. Change tolerancing values in DESIGN (<Ctrl+N>) and repeat. Note how CieParams ensures that DESIGN is set to L*a*b*. Addendum January 24, 2020...As suggested by Ron Willey, a new Excel workbook supports MacAdam ellipses. There are now two radii and a tilt angle. Should you wish to modify the workbook, unhide columns R-AD. Copy the Purple Filter design(s) to C:\Winfilm\Designs. The Full Version example includes CIE xy and u'v' in addition to L*a*b* (Purple.zip: MacAdamTolBox.bas, xyPurple.faw, LabPurple.faw, u'v'Purple.faw). The workbooks listed below were corrected and updated Jan 31.
Having implemented the Excel yield
calculation, we wondered if the ellipse could serve as a Tolerance
Box (Polygon) in DESIGN's built-in CIE tolerancing. As this did not work
properly, the algorithm was updated in DESIGN 2.61.4445. Note that a FILM Archive
file saves Tolerance Box coordinates, making it easy to use the same MacAdam ellipse with different designs.
Willey's 9 layer purple filter has been updated to include the ellipse shown above. Although it looks different due to different vertical axes scales, it's the same ellipse as in the Excel workbook. In addition to copying MacAdam Ellipse coordinates from Excel, users can generate coordinates with the following FilmStar BASIC code (added Jan 31, 2020) and DESIGN 2.61.4460 or MEASURE 2.51.1970 or newer.
October 25 Wedge Mode
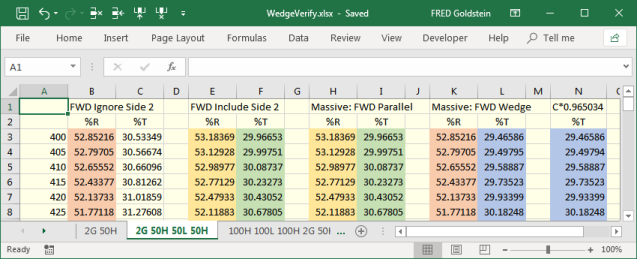
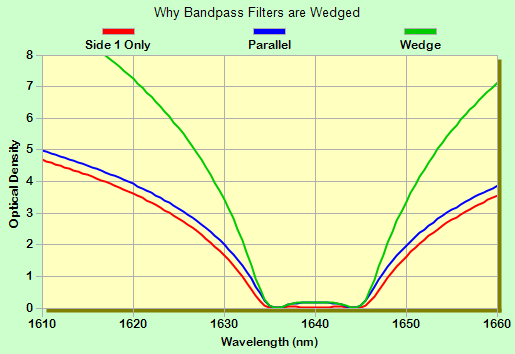
Massive Layers A user had questions about Wedge Mode (massive layers). In reviewing the subject we realized that the concept might not be clear. Wedge Mode returns reflectance from the first (uncoated or coated) surface, while transmittance values at each surface are simply multiplied. Coherent multiple reflections within films are included, but multiple incoherent reflections between surfaces are not. This is verified in an Excel workbook illustrated below.
Side 2 Compensation settings in Setup...Parameters are now relabeled when there are massive layers in the design. The new settings are 1-FWD Parallel (1) and 6-FWD Wedge. Consider a bandpass filter (e.g. fnum.faw) deposited on both sides of a non-absorbing substrate. While similar Parallel blocking can be achieved with absorbing substrates, peak transmittance is reduced.
November 14 Flip Fixture Optical
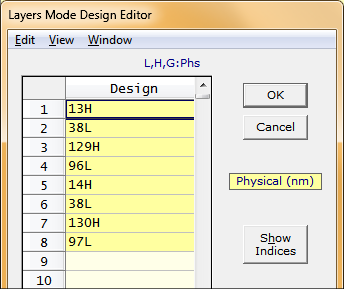
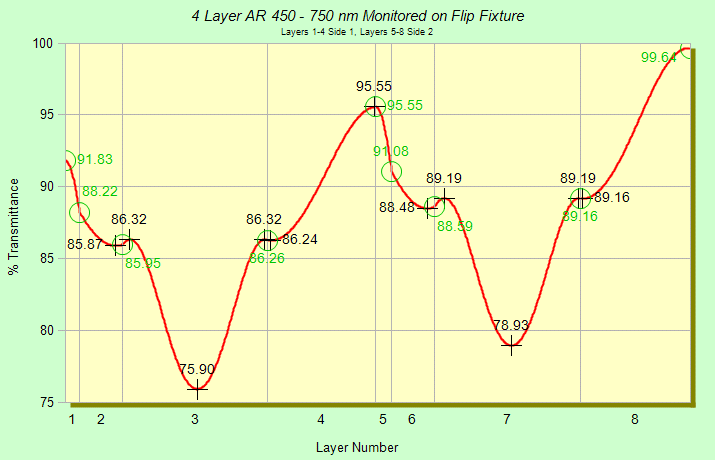
Monitoring Consider a 180° flip fixture for applying
optical coatings, typically AR, to both sides of
a substrate. Optical transmission monitoring is employed. We simulate this
in FilmStar DESIGN with a
macro which effectively flips the optic. Download
FlipMonitor.zip
for a 4 layer AR example (FlipMonitor3.zip
for a 3 layer AR). Copy .faw files to
c:\Winfilm\Designs and run FlipMonitor.bas (FlipMonitor3.bas). Actual Design:
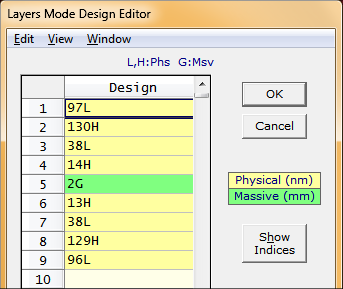
97L 130H 38L 14H
2G 13H 38L 129H 96L
FlipMonitor.bas
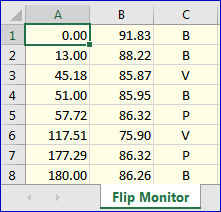
utilizes new features in DESIGN 2.61.4282: 1. BASIC Sub SetLayersIgnore and ability to save %R/%T vs.
thickness as XLS/XLSX. 2.61.4283 (19 Nov) adds the ability to
display cut-off values. Click View..Peaks in the FSPlot
Module. Users experiencing difficulty obtaining the above graph
should contact FTG Software to arrange a
ZOOM meeting.
|
Copyright © 2023 FTG Software Associates
Last updated on
March 16, 2025




 Clipboard transfer works, but far too complicated
 Work Row 1: Field names Row 2: Numeric or text data