MONITOR interactively converts designs to practical coating recipes for manual and automatic optical monitors such as those manufactured by the Eddy Company, Evatec, Leybold, and Intellemetrics.
|
||||||||||||||||||||||||||||||||||||||||||||||||||||||||||||||||||||
|
||||||||||||||||||||||||||||||||||||||||||||||||||||||||||||||||||||
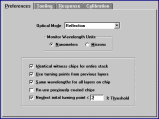
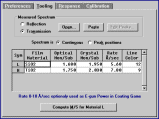
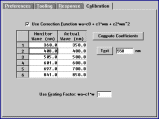
Coating Chamber ParametersParameters include optical and physical tooling factors and spectral response. Numerous calculation modes support a wide range of manual and automatic monitors. It is possible to vary gain and offset for any layer. Optical monitor tooling factors can be determined from measured spectra. As coating chamber indices may differ from design values, two dispersive index files are utilized simultaneously. Film indices and calculation parameters appropriate for manual or automatic monitoring modes are stored as parameters files. Typically each coating chamber has its own file. Coating designs generated by FilmStar DESIGN may be loaded from disk or pasted from the clipboard. Designs containing repeated layer groups, i.e. (.25H .25L)10 .25H, are converted into individual layers. Designs can be edited in MONITOR, but this can be disabled to prevent unauthorized changes. Monochromator calibration is often ignored. Calibration is essential when monitoring over a wide range...say 450 to 750 nm. |
||||||||||||||||||||||||||||||||||||||||||||||||||||||||||||||||||||
Witness Chip ManagerUsers can assign or re-assign any number of layers per chip. Different indices may be assigned for each witness chip. It is possible to drop witness chips (cassette) or re-use previously coated witness spots. Witness chip distribution can be reassigned at any time and the entire run-sheet recalculated without re-entering data. Note that colors follow the chip distribution. |
||||||||||||||||||||||||||||||||||||||||||||||||||||||||||||||||||||
|
|
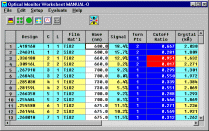
Calculated Monitor QuantitiesMONITOR calculates signal changes (swings) as typically observed on a strip-chart during reflection or transmission monitoring; crystal monitor settings are included for thin or difficult layers. Color codes help the user select optimum wavelengths. Here, for example, the red color indicates that the user should select a different wavelength for chip 2. Output includes coating run-sheets in any Windows-compatible language. Special support is provided for Balzers GSM-420 and Leycom IV operation. Processes may be automatically uploaded to Eddy Company IQ-145 and LMC-10/20 automatic optical monitors. Reverse engineering mode determines the thickness of erroneous layers and helps users deduce the consequences of different monitoring strategies. An automatic mode determines the effects of overshoot strategies in the production of high precision bandpass filters. MONITOR's central feature is an interactive worksheet. Normally the user starts by calculating with default wavelengths. Wavelengths for each layer are subsequently adjusted for optimum sensitivity and selectivity. Any layer can be changed in any order and new layers can be inserted without affecting prior settings. |
|||||||||||||||||||||||||||||||||||||||||||||||||||||||||||||||||||
 Run-Time Estimator |
Coating Run-TimeThe Coating Run-Time calculation takes into account layer thickness, tooling factors, rise/soak times, etc. When combined with tolerancing, users have the necessary means to predict coating costs. |
|||||||||||||||||||||||||||||||||||||||||||||||||||||||||||||||||||
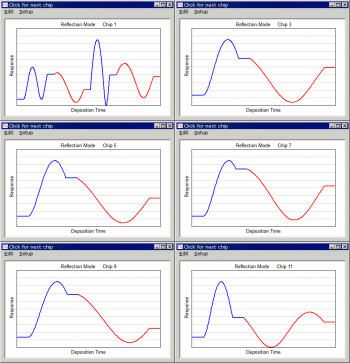
Strip-chart SimulationSupplementing the interactive worksheet, the strip-chart graph has a number of adjustments including colors and chart format (left to right or right to left). While many users prefer the same gain and offset for all layers on a chip, others require that these be reset as more layers are deposited. Both modes are supported. Settings for thin layers can utilize turning points in previous layers on the same chip (a very effective strategy). |
||||||||||||||||||||||||||||||||||||||||||||||||||||||||||||||||||||
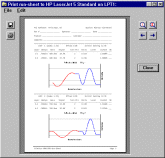
Coating Run-SheetOnce monitor wavelengths are determined, results are be translated into coating run-sheets, the actual instructions used by machine operators. Recognizing the different requirements of coating facilities, run-sheets can be modified according to user-definable templates and printed in any language. Field codes embed calculated numbers within documents. Users may include design description, design file name, date, reflectance and transmittance values, etc. Run-sheets with embedded strip-chart simulation plots following each chip may be printed directly from FilmStar MONITOR.
|
||||||||||||||||||||||||||||||||||||||||||||||||||||||||||||||||||||
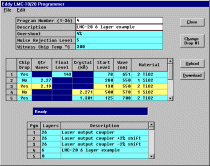
Automatic MonitorsFTG Software supports a range of automatic monitors. In the cases of Leycom IV, SYRUSpro, and Intellemetrics files are exported. In the case of Eddy LMC monitors values are transferred via RS-232. If your automatic optical monitor is not yet supported by FilmStar, please contact us. Manual optical monitoring? Click here to discover unique software for training coating technicians. |
||||||||||||||||||||||||||||||||||||||||||||||||||||||||||||||||||||
Click here for our flyer 'Optical Monitoring with Design Software?'

