| This 'web paper' is provided as a service to
optical thin film engineers and scientists who are concerned
with coating yields. To the best of our
knowledge this method has not previously been published. Please
feel free to forward this paper or
web link to
colleagues. This work was presented at the 2008 SPIE European Optical Systems Design conference in Glasgow. The actual paper is available in PDF format. |
|
On the reliability of inverse-synthesis in optical coatings
Fred
Goldstein PhD Coatings are subject to random, systematic, and gross (operator or machine) errors. In the case of random or systematic errors, inverse-synthesis (reverse-engineering) by least-squares fitting provides means to determine which layers had thickness errors. The process is similar to thin film design, except that here the targets are the measured data. Unlike coating design, where many acceptable solutions are possible, inverse-synthesis requires a unique and correct solution. We calculate the reliability of inverse-synthesis by the following general method:
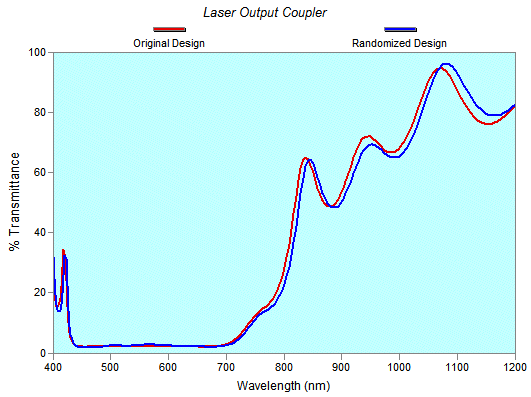
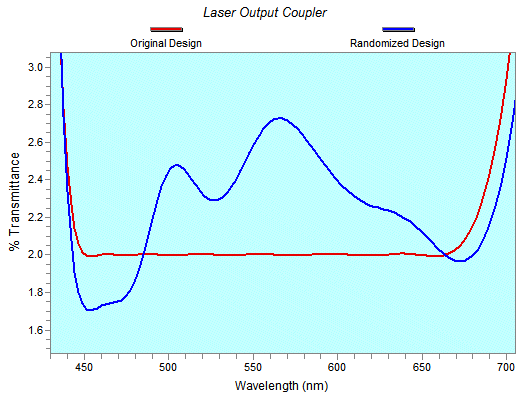
Using FilmStar BASIC, the above sequence is automatically repeated until the statistics become clear, say 50 iterations. The example below shows an iteration of a 26 layer laser output coupler (T=2% from 450-650 nm) with StdDev = 2% random errors. The same graph zoomed clarifies the deleterious effects of Std Dev = 2% random errors in the range of coating performance.
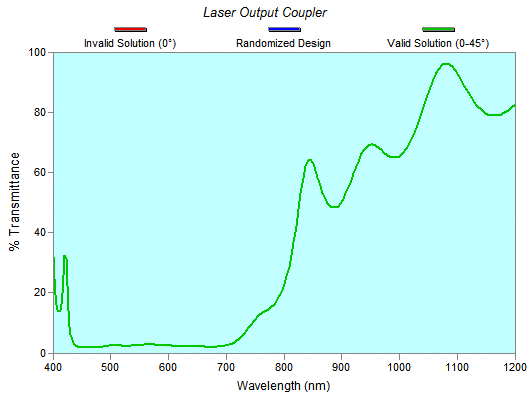
The blue trace (simulating a coating measured at normal incidence from 400 to 1200 nm) is converted to optimization targets and the original (red trace) design restored. Using DLS we solve for the blue spectrum and compare the solution to known layer values. In the case of visible coatings, it seems reasonable to extend measurements to the long wavelength side rather than the short side where dispersion effects will be more pronounced. The graph below shows results. The blue curve represents the known solution while the red (Invalid Solution, 0°) and green (Valid Solution) curves were calculated by DLS. In the graph below, curves are superimposed and cannot be separated. Most importantly, the graph shows no differences between valid and invalid solutions.
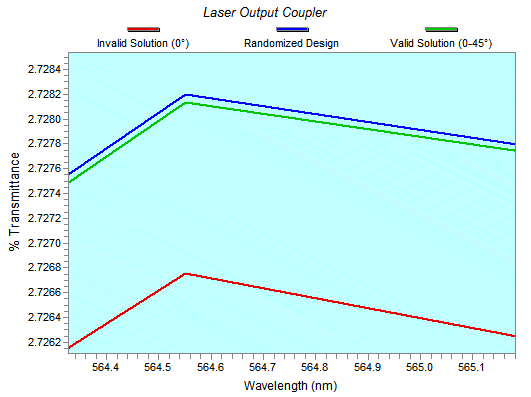
Zooming the graph, we eventually see differences, but notice the %T scale!
Using the range 400-1200 nm and an accuracy criterion of 0.5% we determined that reliability is essentially zero. Adding spectra (targets) at 45° (P & S polarization) increased the reliability to 100%. Our results strongly suggests that coating facilities may achieve dramatic benefits from upgrading their measurement technology well beyond the minimum required for pass/fail analysis. Using the actual performance range 450-650 nm, reliability at either 0° or 0-45° is zero. Reliability depends on the type of design, number of layers, magnitude of errors, measurement range, angle, and accuracy criterion. Repeating the analysis for a four layer 450-750 nm AR coating with layer StdDev = 5% gave 100% reliability (0.5% accuracy) for calculations over the range 450-750 (0°). When StdDev = 20% (simulating large errors), reliability becomes 56% (0°); expanding the range to 400-1200 nm gives 76% (0°) and 92% (0-45°). Experienced coating engineers are familiar with these ideas. What is new here is the general method for estimating reliability. While 100% theoretical reliability does not guarantee 100% in practice, failure of the theoretical simulation guarantees failure with measured data. Suggestions for further work include:
The work described in this paper can be reproduced with the FilmStar Free Version, revision 2.50.0842 or newer. The required macros are included in the installation. The graphs displayed above were generated directly by FilmStar. Copyright © 2007 FTG Software Associates |


