Laser Focus World, April 2014
|
This page supplements
Excel
extends optical coating software capabilities. Examples can be freely tested.
Some of the examples are discussed in Dave Taddeo's YouTube
FilmStar with Excel.
Examples may require that you change Excel security settings. By default
Microsoft disables the Developer ribbon. Click File.. Options Customize
Ribbon and add the Developer tab. You also need to adjust Trust Center
settings by enabling macros and Trust access to the VBA project object model.
Please contact author Fred
Goldstein if you have questions or need help (Windows
10, Excel 64-bit issues).
When debugging VBA code for FilmStar, an
error (e.g. missing DESIGN dispersion file) is aggravating as Excel continuously
attempts to repeat the calculation. We recommend that you download two 'killers'
to close FTG Software
programs and Microsoft
Excel. Alternatively <Ctrl+Shift+Esc> accesses the Task Manager.
Sep 2017 ...FTG programs
directly read and write Excel XLS/XLSX files. Excel is not required, thereby
simplifying operations
and enhancing QA security. Click
here and here
to learn more.
Apr 2018 ...FTG programs
add the ability to insert Excel formulas. Click
here to learn more.
|
Color tolerancing files:
RandColor.xlsm
SpectralCalculator5nm.xls
ExcelRand.bas
RandColor.xlsm utilizes
Bruce Lindbloom's
SpectralCalculator5nm.xls to compute CIE color values from multiple spectra, in this case
spectra generated
from a tolerancing model in which layers are randomly varied to simulate
manufacturing errors. Ultimately we want to relate layer errors to color
variations. Our thanks to Bruce for making
his work freely available. 19 Jul 15: RandColor.xlsm replaces RandColor.xls;
ExcelRand.bas updated accordingly.
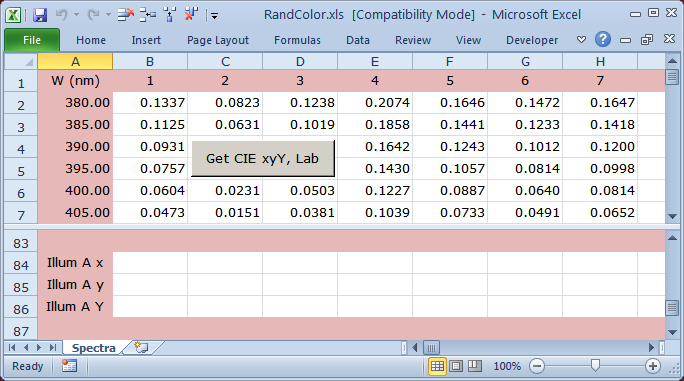
RandColor.xlsm transfers spectra to SpectralCalculator5nm.xls and returns
color values. Both workbooks must be open within the same instance of Excel.
RandColor.xlsm's 10 spectra can be replaced with any number of columns of reflectance or
transmittance values with wavelength range 380-780 x 5 nm. Our spectra were
generated with FilmStar BASIC (FSBasic) program ExcelRand.bas which can be
tested in the FilmStar Free Version.
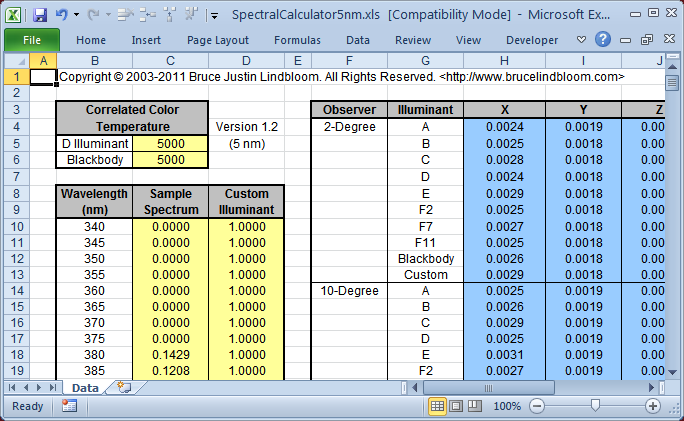
SpectralCalculator5nm.xls - Yellow denotes data input cells; blue cells
contain calculated results. The workbook cannot otherwise be modified.
CIE analysis can be performed directly in
DESIGN/MEASURE, as in L*a*b* Color
Tolerancing. The point of this section is that Excel workbooks programmed by
others can be adapted to your requirements. Exercise: add
MacAdam ellipses to
RandColor.xlsm.
Color map file:
Colors.xlsm (Full
Version)
ColorsF.xlsm (Free
Version)
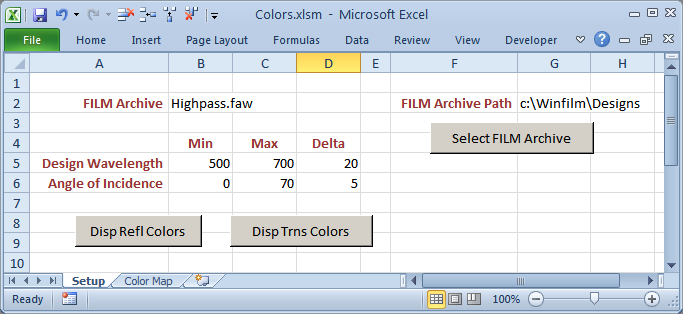
Setup tab specifies calculation range
Colors.xlsm (Excel 2007 or newer
required) displays RGB values calculated in the background by FilmStar. This example
can be tested in the FilmStar
Free Version. Since Design Wavelength is varied, designs must utilize
optical thickness. (Instructive exercise: modify the workbook for designs in
physical thickness.) Color maps are also useful for analyzing the
effects of layer errors.
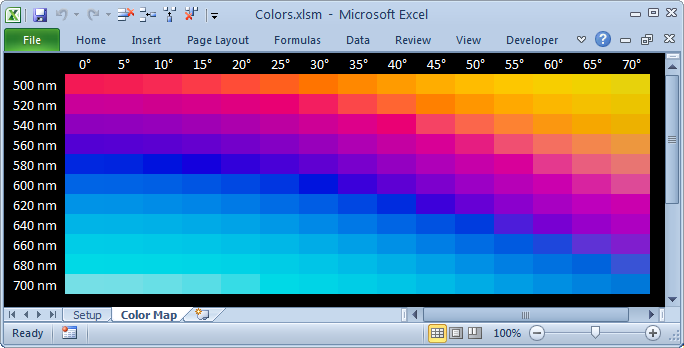
Excel 2007 or newer is required as older Excel
versions do not support the full 16M color range.
Optical glass Workbooks (XLSM):
Ohara
Schott
Hoya
CDGM
The workbooks create W,n,k tables from
manufacturers' data and do not require FilmStar. Click <Export> to select and
copy a table to the clipboard. Can't find the glass you need? We've also
extracted 2930 glasses from the
Code V
XML glass catalog.
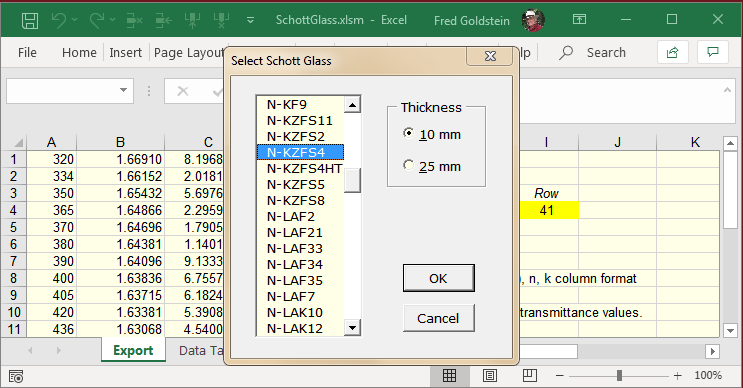
'Export' worksheet added to original Schott worksheet
FilmStar
includes 731 extracted n,k (*.itw) files (t=10mm) under ..Winfilm\Index. FilmStar macros (e.g.
HoyaGlass.bas) automatically convert data to *.itw.
Caveat: Workbooks and n&k tables are
provided without warranty. Use at your own risk and compare with original
Ohara
Schott
Hoya
CDGM
data and/or
RefractiveIndex.INFO. Please notify FTG Software of any discrepancies.
QA database files:
FM12_GetSpectrum.xlsm
FM12_GetSpectra.xlsm
Spectra_12.fmp12
|
Database software provides means
to save and recall information about coating runs. That information includes
spectral data. As databases are not intended for engineering calculations, we
apply Microsoft Excel to the task of automatically extracting spectra for
further analysis.
Excel workbook
FM12_GetSpectrum.xlsm copies a spectrum from FileMaker database Spectra_12.fmp12.
FM12_GetSpectra.xlsm copies multiple spectra and computes % yield. FileMaker Pro version 12-19 is required; a
FREE TRIAL
is available.
When opening Spectra_12.fmp12 you are asked for Account Name [Fred (full access), and Password [Fred]. Signing on as Guest grants browsing access only.
Note differences in menus, with a Guest having no ability to alter the
database. These security features reduce the possibility
of QA
catastrophes. |
 |
With FileMaker open select
the records you wish to analyze and click Load
Spectrum. You might, for example, want to test whether coating performance
varies with technician. How does a tighter tolerance affect yield? Why FileMaker Pro? 1. Many thousands of spectra stored
in a single file, 2. Easy to use, database expertise not needed, 3.
Compatible with corporate 'enterprise' databases
like Oracle, 4. Integration with thin film design
software for analysis and reverse-engineering, 5. Supported by FTG Software.
Cited and related Excel links
General discussion:
FilmStar and Excel
Copy/paste:
Extracting illuminant data,
Importing index tables,
Intellemetrics FilmMaker
Coating designs:
Rugate designs,
Tolerancing with index variations,
Eliminating side 2 reflectance,
L*a*b* Color Tolerancing
Multiple spectra: %R, %T vs.
temperature, ARTA (Absolute
Reflectance/Transmittance Analyzer), Saving multiple
spectra, Reflectance vs. wavelength and
layer thickness, Cary UMA,
Bandpass/edge filter calculator
FilmStar BASIC-Excel
interoperability: Excel VBA, FilmStar
BASIC Objects
|