The Scantraq report generator prints documents combining text and graphics.
|
|||||||||||||||||||||||||||||||
Report Generator DialogText can be static or calculated; graphs can come from the SQPlot Module, from metafiles (.wmf) and bitmaps (.bmp). Users can select fonts, margins, etc. This provides Scantraq users with tools for delivering repeatable, reliable and traceable QC results. Customers expecting scribbled results on a Lambda 9 strip-chart will be impressed with laser-printed reports including calculated pass/fail results as well as a clear rendition of the supplier's logo. Reports can be printed or saved in three formats: binary (can be opened by Scantraq), Adobe PDF, or RTF (can be opened and edited in MS Word). |
|||||||||||||||||||||||||||||||
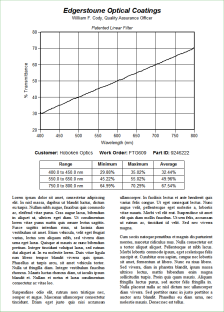
Report TemplateThe template describing a report contains text plus format codes like <<italic 0>> and action codes like <<WbText E6>>. Templates can include text created in Scantraq BASIC, or the entire template can be assigned in Scantraq BASIC.
In the above example action code <<WbText E4>> is replaced by the text "MEETS" in Scantraq Workbook cell E4. Average and maximum values are taken from E6 and E7. The Scantraq logo is a vector graphic (Windows metafile). |
|||||||||||||||||||||||||||||||
 Click for PDF |
Reports in Word While the Scantraq Report Generator is very useful for many purposes, it does not readily support complex formatting. It lacks tables, has problems with mixed fonts, etc. As documents become more complex, the Report Template becomes unwieldy. As a recommended alternative, Microsoft Word can be utilized as print server. Variables transfer values to the document. An illustrative Word template document plus corresponding BASIC macros are included. These provide a framework for users requiring utmost professionalism in QA, quotations, etc. Documents can be printed directly, as if generated solely by Scantraq. Alternatively the Word print preview screen can be activated, thereby adding the ability to verify before printing. You already have MS Word, so why not maximize its benefit? Contact us for an online demonstration!
This will not work with the pre-installed |
||||||||||||||||||||||||||||||