|
The FSPlot
Module provides publication-quality annotated
graphs which can be automatically inserted into documents.
|
FSPlot images
can be copied or saved as .wmf (metafiles), .bmp
(bitmap) or .png (web bitmap). Metafiles
are publication quality vector images which print at high resolution.
Bitmaps
are recommended for web pages. For a metafile sample, download
fsplot.wmf (11K) and copy and paste the image into Word or Excel.
|
|
Graph from ???.com
FSPlot Options |
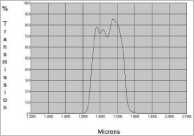
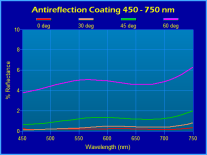
The
Image your Coatings Deserve
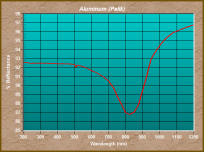
Examine coating
curves on your company's and competitors' websites. Do they resemble
the top graph (from actual web page)? Not only is the graph rather
shabby, it fails to provide important information about the blocking
region.
FilmStar MEASURE directly supports
spectrometers used to measure optical quality. That support includes
publication quality QA graphs and reports. The same graphic
capabilities in FilmStar DESIGN are useful for proposals and
quotations. FilmStar even includes a macro with choices 'Print in
Word', 'Web Page', 'PowerPoint'.
But pretty graphs
are not enough. That's why FilmStar options include multiple axes
(%T/OD) and even 'diabatic'
transmittance. Need a single plot from UV/Vis to IR? FilmStar
includes log wavelength.
Some might dismiss
these capabilities as 'bell and whistles'. But we think that
professional quality web and print graphics indicate the care taken to
deliver the highest quality coatings.
|
|
FSPlot Dialog
|
Annotations
Annotations are
graphics and text placed directly on a plot. These are especially
useful
for quality control graphs where customers often specify pass/fail
criteria in geometric terms -
for example, the spectrum must be within certain lines.
Tutorial III.
As illustrated
here, there are a variety of annotations. In addition, up to 12 line
legends (not shown
here) are possible. Legends and annotations are stored on disk with the
FILM Archive
file (DESIGN) or Scan Parameters file (MEASURE). For a further
understanding of FSPlot options, click here
(FsPlotOptions.xls, 304K).
FilmStar Graph Automation Video
|
|
FSPlot Annotator
|
FSPlot
Annotator
Annotations (lines, symbols,
text, axis labels, etc.) are easily added
by
clicking on the graph to bring up the FSPlot Annotator. This
dialog demonstrates adding a horizontal line T = 50%. Made a
mistake or prefer a different color? Click on the annotation to edit or
remove it.
|
|
Graph Automation
|
Integration
with FilmStar Modules
The FSPlot Module is tightly
integrated with the Report Generator and with FilmStar BASIC.
In this simple example, the
FSPlot Module is controlled by FilmStar BASIC, enabling us to
automatically display color shifts as the angle of incidence is varied.
Up to 12 graph legends can be automatically added. Note the ability to
plot curves with RGB line colors.
FilmStar Graph Automation Video
|
|
Computed Annotations
|
As shown here,
annotations can include automatic results calculated from theoretical
or measured spectra.
This is very powerful and not available in software supplied by
spectrophotometer
manufacturers.
The development
of computed annotations was inspired by
watching technicians manually mark up measured spectra. The technique
relies on
setting PlotAnnotation$ in
FilmStar BASIC
(click to view code).
|
|
FSPlot Formulator
|
FSPlot Formulator
The FSPlot
Formulator supports arithmetic operations on data
columns. This is
typically utilized to show detail in pass and rejection bands on the
same graph. It can
also be used to compute and plot
averages or differences. Once a plot formula is developed it is
automatically applied to new graphs. Tutorial IV. The formula used in
this plot is
C=B;B=if(A>420&A<520,100*B,if
(A>650&A<850,100-(100-B)*20,B))
|
Web
Graphics
Th FSPlot
properties editor provides unlimited options when Bitmap/Gradient
mode is selected. A logo or watermark can be added. Graphics matching a
company's color
and font scheme give a more professional appearing
website. Tutorial I.
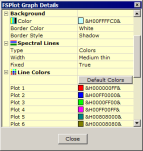
FSPlot properties |
True blue motif |
Earth tones? |
|
Contour Plots
FilmStar DESIGN
supports 3D contour plots as illustrated
here.
Reflectance vs.
Angle
2D Contour |
Reflectance
vs. Angle
3D Contour (Excel)
|
|